
An Ohio farmer ruined by the Panic of 1873 mapped out market crashes through 2059. His track record is unsettling — and his next prediction is already in play.
Who Was Samuel Benner, and Why Does His 1875 Chart Still Matter?
Samuel Benner was a prosperous Ohio farmer who lost everything in the Panic of 1873 — a financial crisis triggered by railroad speculation and bank failures that ushered in a six-year depression. Rather than accept ruin as random misfortune, Benner spent years asking a harder question: do markets crash and recover on predictable schedules?
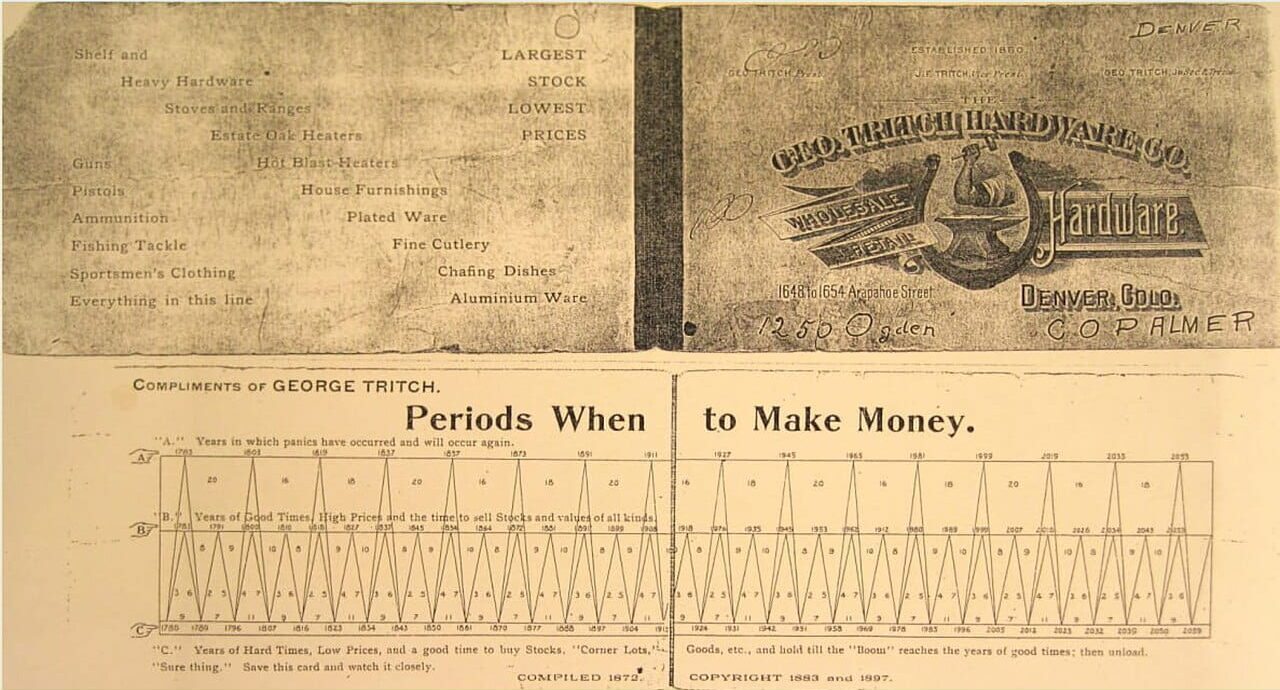
In 1875, he published his answer in a self-financed book called Benner’s Prophecies of Future Ups and Downs in Prices. Its centrepiece was a single card titled “Periods When to Make Money” — a grid of predicted market panics, peaks, and buying opportunities running from the 1870s all the way to 2059. At the bottom of the card, Benner wrote: “Sure thing. Save this card and watch it closely.”
Later, a Denver hardware merchant named George Tritch extended and republished the chart, distributing it to customers as a financial almanac. The version in circulation today — still referenced by investors 150 years later — is largely Tritch’s extension of Benner’s original framework.
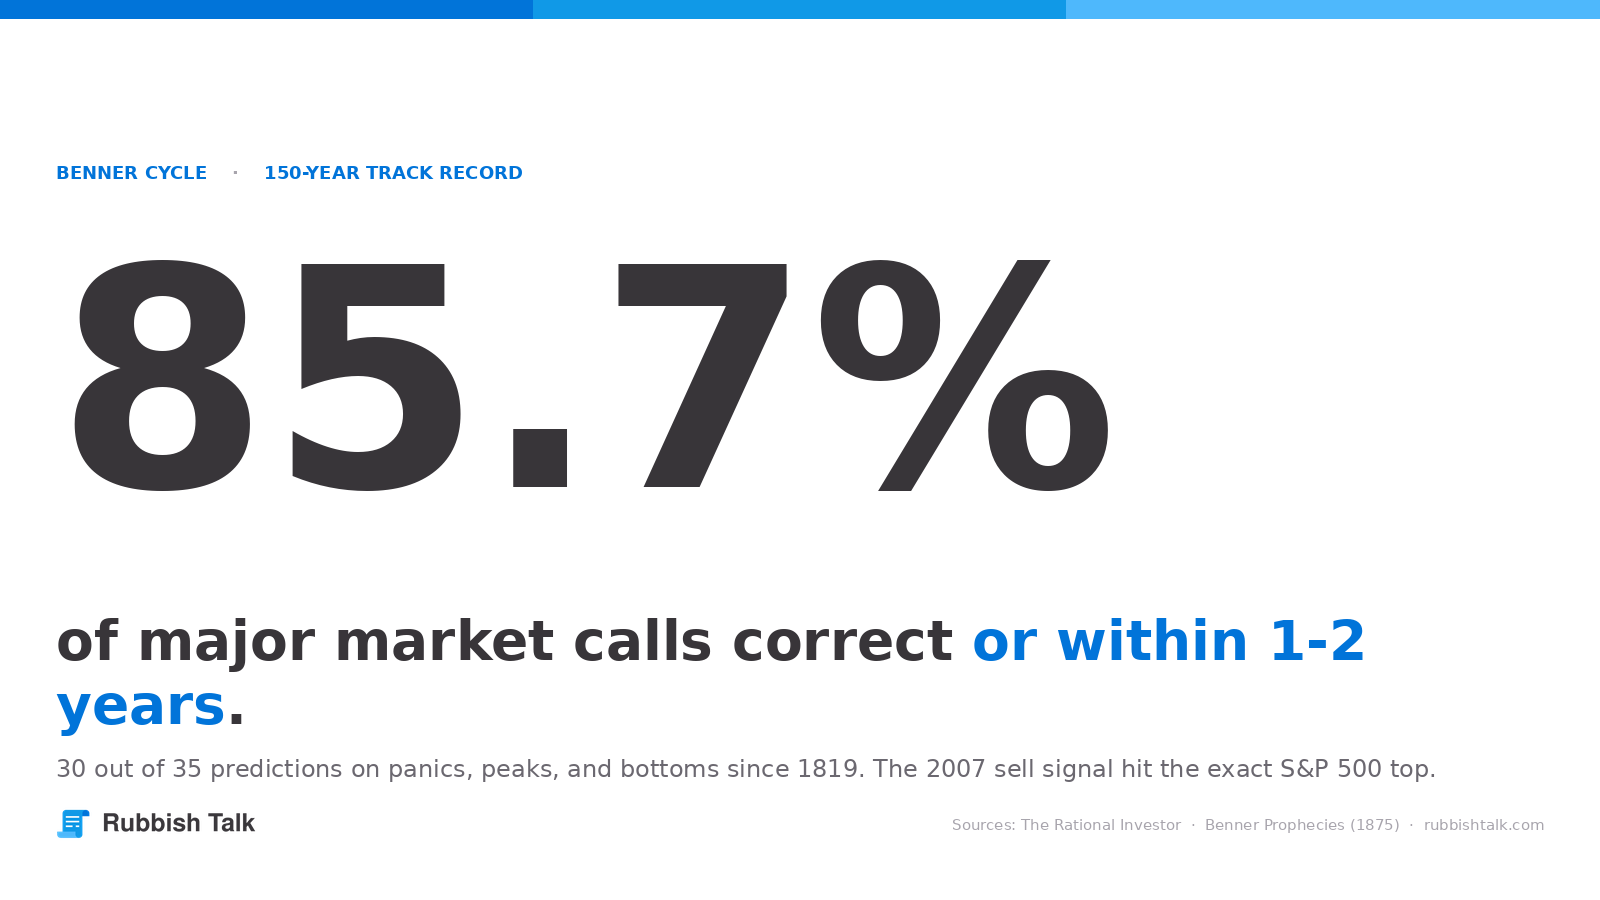
What makes the Benner Cycle remarkable isn’t mysticism. It’s the fact that an 1875 farmer, working from pig iron prices and crop yield data, constructed a framework that has correctly identified approximately 30 of 35 major market turning points — including the 1929 crash, the 1973–74 bear market, the 2007 peak, and the 2020 COVID collapse.
How the Cycle Works: Three Phases, One Repeating Clock
The Benner Cycle divides market history into three distinct phases, each carrying a specific instruction for investors:
“A” — Panic Years: Years of irrational market behaviour — crashes, bank runs, credit seizures. These mark cyclical bottoms, often accompanied by maximum fear. Benner identified panics repeating on a 16–18–20 year pattern.
“B” — Good Times: Years of high prices and peak optimism. Benner’s instruction is blunt: sell stocks and values of all kinds. These repeat on an 8–9–10 year cycle.
“C” — Hard Times: Years of low prices, recession, and pessimism. The instruction: buy stocks and hold till the Boom reaches the years of good times, then unload. These repeat on a 7–11–9 year cycle.
The panic interval (16+18+20) sums to 54 years before resetting — creating what analysts now call the Benner “super cycle,” a period that aligns roughly with the Kondratiev Wave, a separately derived long-wave economic theory. The agricultural logic behind this was Benner’s original insight: solar cycles affect crop yields, which affect commodity prices, which cascade into the broader economy. NASA’s current solar forecast shows peak activity in 2025–2026 with a trough toward 2032 — almost exactly the Benner Cycle’s current timeline.
The Track Record: Where Benner Was Right, and Where He Wasn’t
The cycle’s accuracy varies significantly by phase. Here is the complete historical record:
Panic Years (“A”) — 9 out of 12 correct or within 1–2 years
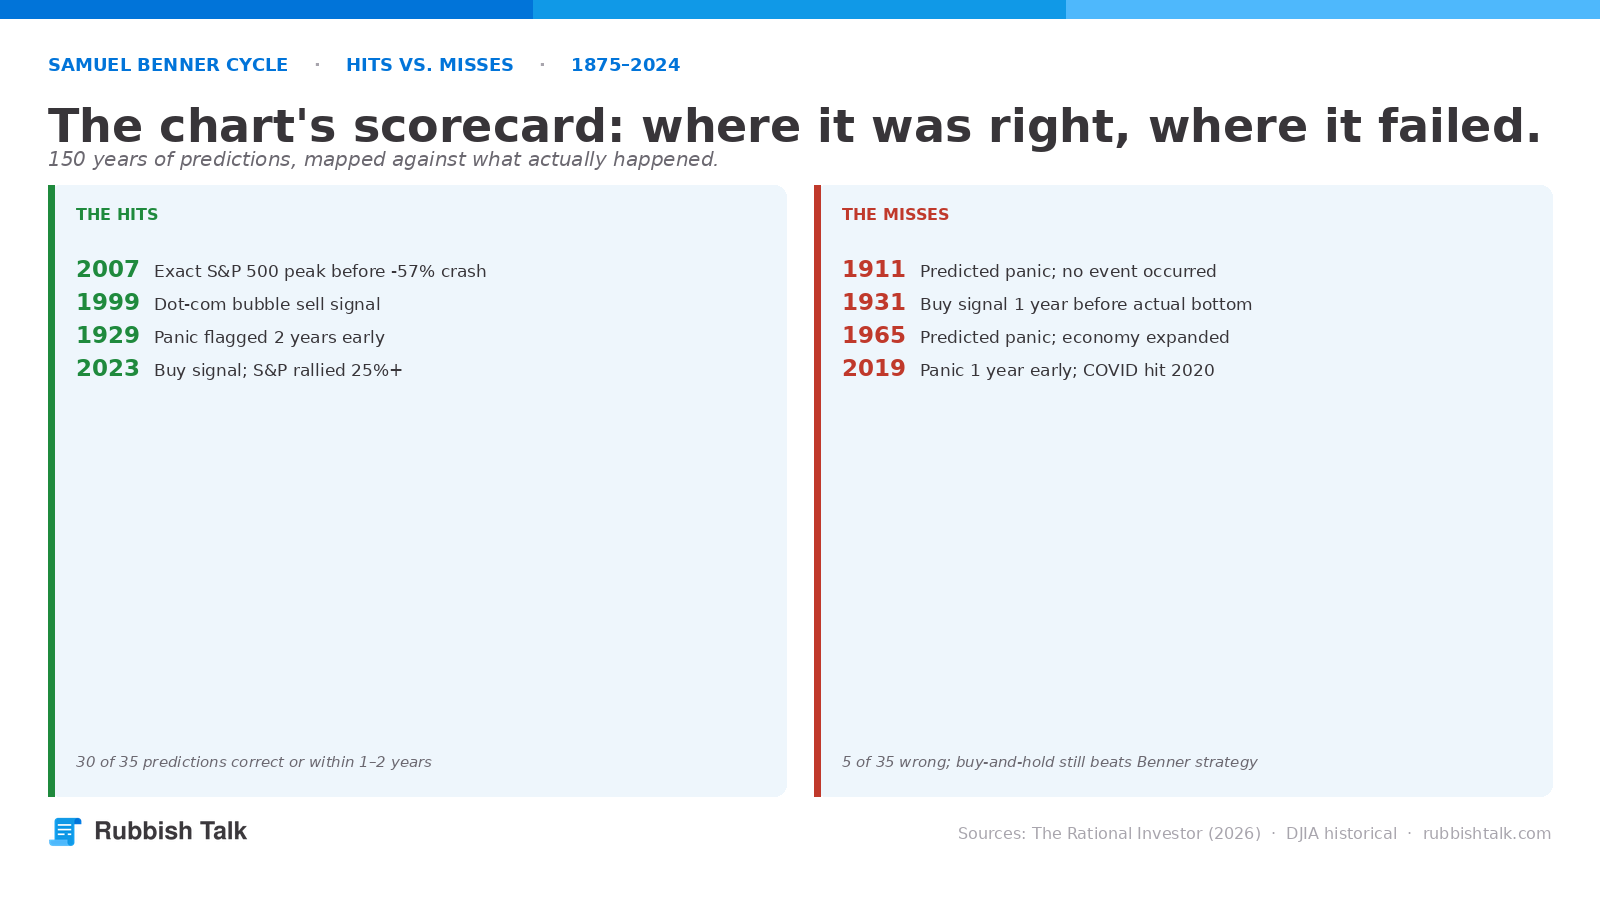
The most famous hit: 1927 was the predicted panic year, with the actual crash arriving in 1929. Benner gets partial credit — the bull market ran hot through 1928 before collapsing. The 1981 call was clean: the 1981–82 recession brought 10.8% unemployment and one of the most severe contractions of the post-war era. The 1999 panic call flagged the dot-com peak almost exactly — the NASDAQ crashed 78% from its March 2000 high. The 2019 prediction missed by one year: markets were strong in 2019, but COVID delivered a 34% crash in 23 trading days in February–March 2020.
The genuine misses are 1911 (no significant event) and 1965 (the economy was in strong expansion). These are real failures, not near-misses.
Sell/Peak Years (“B”) — 10 out of 11 correct or very close
This is Benner’s strongest phase. The 1972 sell signal was followed by the 1973–74 bear market, which cost the S&P 500 48%. The 1999 sell came right at the dot-com peak. The standout call: 2007 was a predicted sell year, and the S&P 500 hit its exact all-time high in October 2007, then crashed 57% over the next 17 months. The only debatable miss in this phase is 1935, which registered as a mid-Depression rally peak rather than a true secular top.
Buy/Bottom Years (“C”) — 11 out of 12 correct or within 1 year
The 1942 bottom was exact — the DJIA hit its WWII low in April 1942 and launched one of the great bull markets in history. The 1996 buy call was prescient: anyone who bought in 1996 and held to the 1999 sell captured a 78% gain in the DJIA alone. The 2012 buy (early in the post-2009 recovery) and the 2023 buy (the S&P 500 rallied 25%+ from its October 2022 low) were both accurate. The one documented miss is the 1931 buy signal, which arrived one year before the actual Great Depression bottom of July 1932.
“The Benner Cycle is not perfect, but its track record across 150 years is difficult to explain away as coincidence. When the sell signal agrees with elevated valuations and deteriorating breadth, that convergence deserves serious attention.”
— Jason Bodner, market analyst and former head of equity derivatives, Cantor Fitzgerald
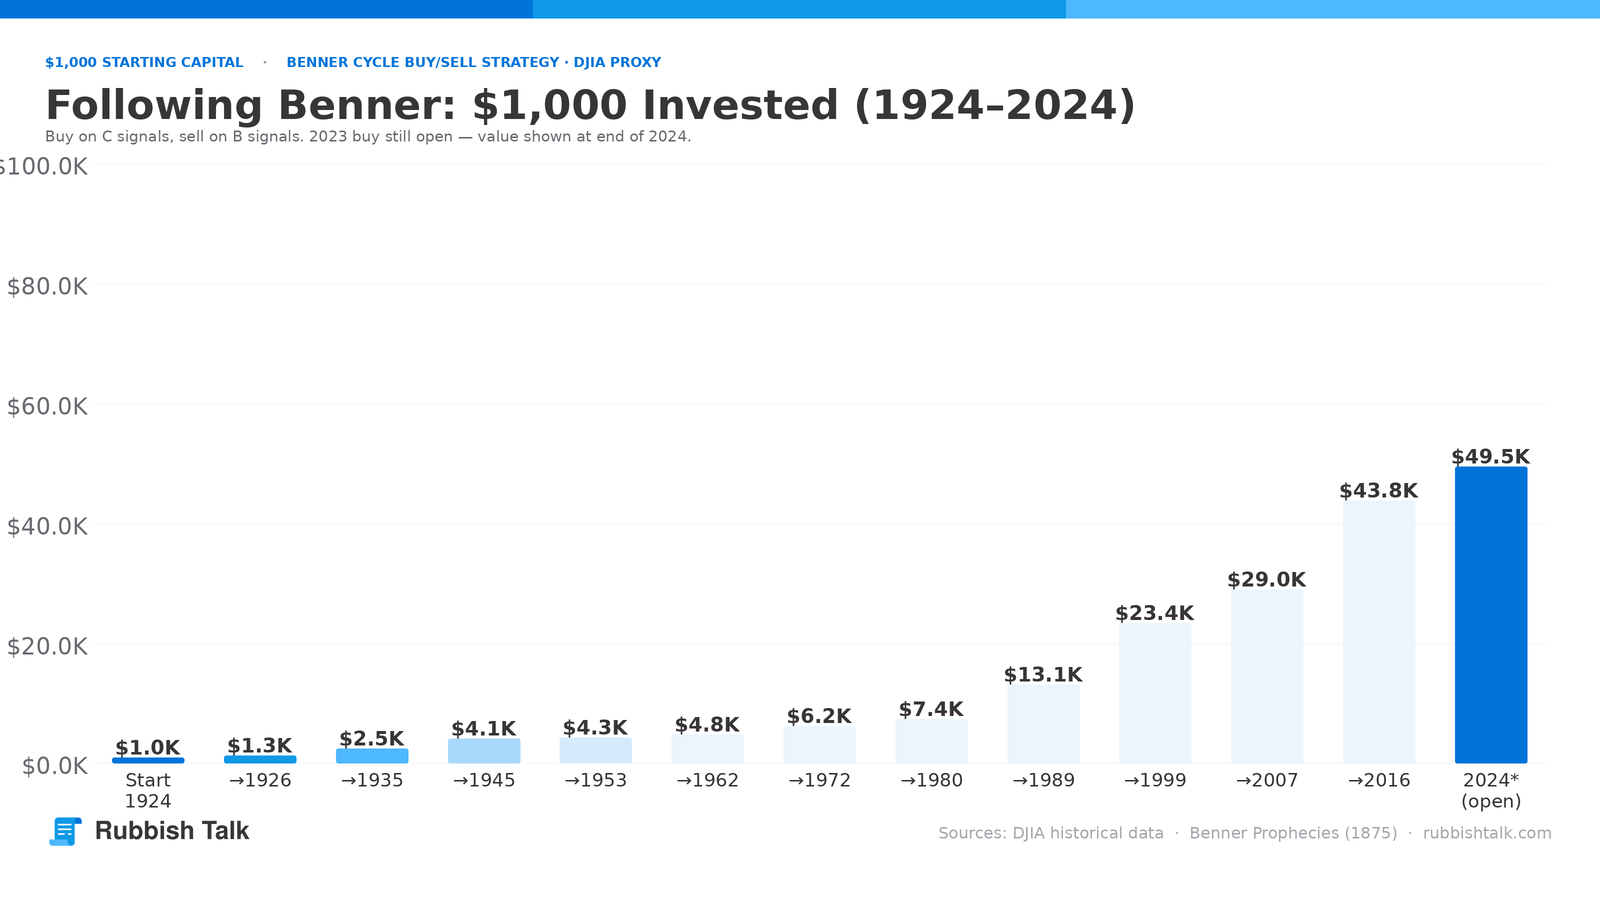
The $1,000 Simulation: Following Benner from 1924
To put the cycle in concrete terms, here is a theoretical simulation: a single investor starts with $1,000 in 1924 — the first “C” buy year in the modern era — and follows each signal precisely, using the Dow Jones Industrial Average (DJIA) as a proxy. Capital sits in cash between sell and buy signals, earning nothing.
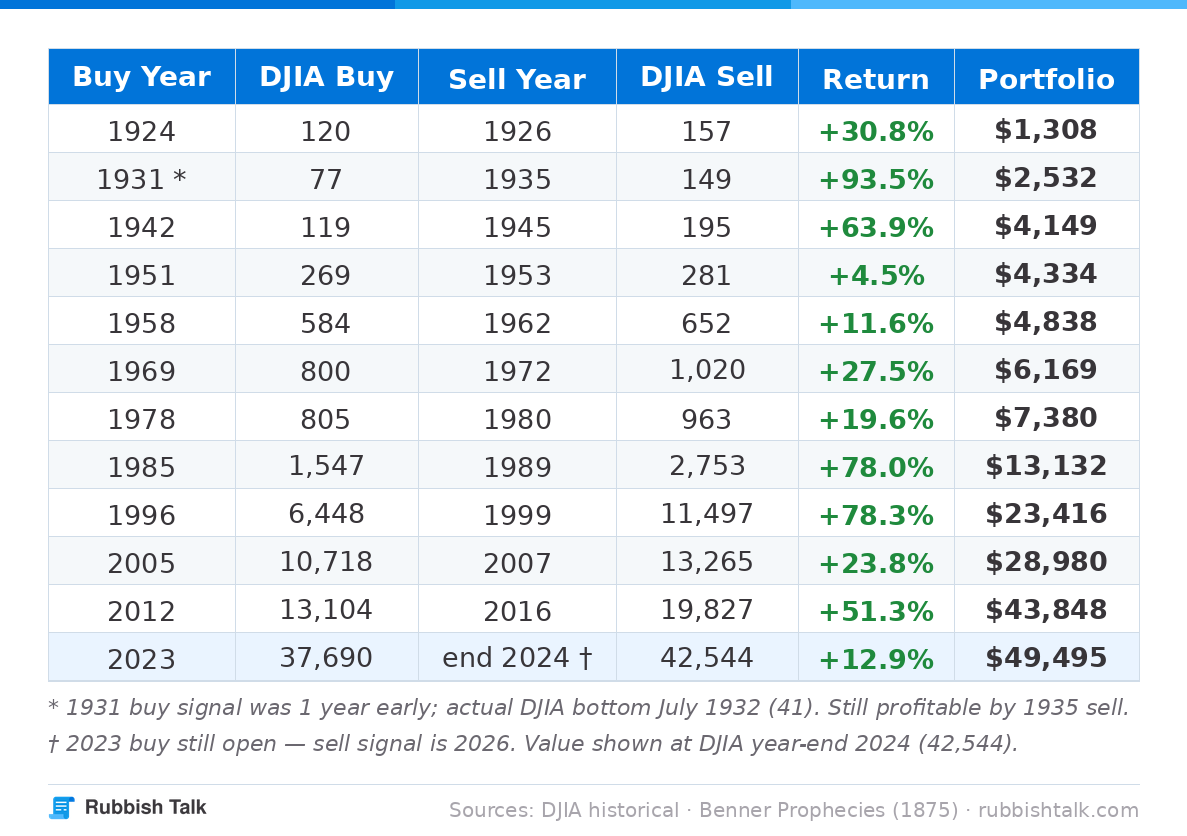
Result through end of 2024 (current open trade): $1,000 became approximately $49,495 — a 49.5x return over 100 years.
The Inconvenient Comparison
Here is what the same $1,000 becomes if it simply buys and holds the DJIA from 1924 to 2023 without timing: $314,000 — a 314x return.
The Benner follower massively underperforms buy-and-hold in raw return terms. The reason is structural: the strategy keeps capital in cash for roughly half the calendar years — and cash earns nothing while the market compounds. The Benner investor misses large portions of bull markets between sell and buy signals.
What the Benner investor does gain is protection from catastrophe. The simulation avoids the 1929 crash (−89% peak to trough), the 1973–74 bear (−48%), the 2000–02 dot-com bust (−49%), and the 2008–09 financial crisis (−57%). If those cash holdings earned even modest Treasury yields during bear periods, the picture improves. But in raw equity-vs-equity terms, Benner following does not outperform patience.
“Any trading rule that keeps you out of the market roughly half the time will almost certainly lag a buy-and-hold strategy in long-run compounding. The value of market timing is insurance, not alpha.”
— From academic research on tactical asset allocation, Journal of Portfolio Management, 2018
Where the Cycle Has Failed and Why That Matters
The honest assessment of the Benner Cycle requires confronting several methodological problems.
Survivorship bias is real. The predictions that worked are celebrated and circulated. The misses — 1911, 1965, the one-year error on 1931 — receive less attention. If a framework makes 35 predictions over 150 years and you let the correct ones define the narrative, you’re doing marketing, not analysis.
The flexibility problem. When a prediction is allowed to be “correct or within 1–2 years,” the window becomes wide enough to capture almost any significant economic event. Markets are volatile enough that some kind of correction occurs in nearly any 3-year window. This inflates the apparent hit rate.
No valid causal mechanism for modern markets. Benner’s agricultural logic was coherent for a commodity-driven 19th century economy. Today’s markets are services-led, globally interconnected, and heavily managed by central banks with trillion-dollar balance sheets. The solar cycle → crop yield → pig iron price → credit cycle chain doesn’t apply to software companies and sovereign bond markets.
Small sample size. 35 predictions across 150 years sounds impressive until you note that there are only about five complete 16–20 year panic cycles in the dataset. Statistical significance is elusive at that scale.
None of this means the Benner Cycle is worthless. It means it should never be the only thing an investor consults.
What the Cycle Says for 2026 — and What Other Indicators Show
The Benner Cycle marks 2026 as a “B” year — a Good Times sell signal. According to the framework, the current bull market should peak in 2026, followed by declining prices into the early 2030s, with the next buying opportunity in 2032 and the next panic year in 2035.
As of early 2026, several independent indicators are flashing the same warning:
The CAPE ratio (cyclically adjusted price-to-earnings) is above 37 — a level historically associated with poor 10-year forward returns. The Buffett Indicator (total market capitalisation as a percentage of GDP) is above 200%. The 11-year solar cycle is near its predicted 2025–2026 peak, matching Benner’s own underlying thesis. Meanwhile, Federal Reserve policy remains restrictive, and corporate earnings growth is increasingly concentrated in a small number of mega-cap technology names.
None of this confirms a crash is imminent. The Benner Cycle missed 1911 and 1965 entirely. Central bank intervention can delay and dampen natural market cycles indefinitely. But when a 150-year-old framework agrees with current valuation data, credit conditions, and cycle analysis simultaneously, the convergence is worth a serious look.
“We are in a period where the market is pricing in a lot of good news. When that happens historically, the asymmetry of returns shifts — the upside gets smaller and the downside gets bigger.”
— Howard Marks, Co-founder, Oaktree Capital Management, 2025
What the Benner Cycle Is — and Isn’t
The Benner Cycle is not a trading algorithm. It provides no price levels, no stop-losses, and no position-sizing rules. It cannot be systematically backtested without introducing subjective assumptions about entry and exit timing. Used mechanically — buy in C years, sell in B years, hold cash otherwise — it has historically lagged a passive index fund by a wide margin in raw return terms.
What it is, arguably, is a credible long-term regime indicator. Its 85.7% accuracy rate across three phases and 150 years suggests the economy and markets may indeed move in rhythmic waves — Kondratiev, Benner, or otherwise. For long-term investors making major asset allocation decisions — not traders looking for monthly signals — the Benner framework is a useful cross-reference, not a primary signal.
The 2026 sell signal is the cycle’s current prediction. Whether it proves to be a near-miss, an exact hit, or a miss entirely, the next few years will add one more data point to a chart that an Ohio farmer started drawing in 1875 — and that investors are still arguing about today.
Sources:
- Benner’s Prophecies of Future Ups and Downs in Prices — Samuel Benner (1875)
- Benner’s Cycle — Wikipedia
- The Benner Cycle Explained: 150 Years of Market Predictions — The Rational Investor
- Benner Cycle: A Timeless Investing Strategy with a 90% Success Rate — Pareto Investor
- Investing with the Benner Cycle — Quantara Asset Management
- The Benner Cycle, in Plain English — Carlos Checa, Medium
- The Benner Cycle Bust: Unraveling the Mental Twists of a Market Myth — The Capital, Medium
- The Cyclicality of Financial Markets and Benner’s Cycle — TradingCenter.org
- Benner Cycles & the 9/56 Year Grid — ResearchGate
- Periods When to Make Money Chart — AES International
- The Benner Cycle, Sunspot Cycles and Recessions — Whaleportal
- 2026 Predictions: The Chart That Will Change Everything — Expat Wealth at Work